
Reading Between the Lines of Conforming Loan Limits and Interest Rates
Mortgage rates have been a hot topic for the past few years, with borrowers hoping for some relief. But if history is any guide, we may not see substantial rate drops in 2025. One indicator? The Conforming Loan Limits (CLL).
In the charts below, we’ve compared conforming loan limits (CLL) with mortgage rates over the years, and an interesting pattern emerges—whenever there’s a marked increase in CLL, rates tend to stay high. The only exception? The COVID anomaly, which was a period of massive economic intervention and rate suppression.
So, what’s happening, and why do CLL increases hint at a sustained high-rate environment? Let’s break it down.
What Are Conforming Loan Limits (CLL)?
For those unfamiliar, conforming loan limits (CLL) dictate the maximum loan size that can be backed by Fannie Mae and Freddie Mac. When CLL increases, it’s a sign that the government sees housing prices rising and wants to ensure borrowers still have access to affordable financing without requiring jumbo loans.
But a rise in CLL is not just about home prices. It is a direct reflection of how the broader economy and housing market are being viewed—by regulators, banks, and policymakers.
The Historical Relationship: Mortgage Rates and CLL Increases
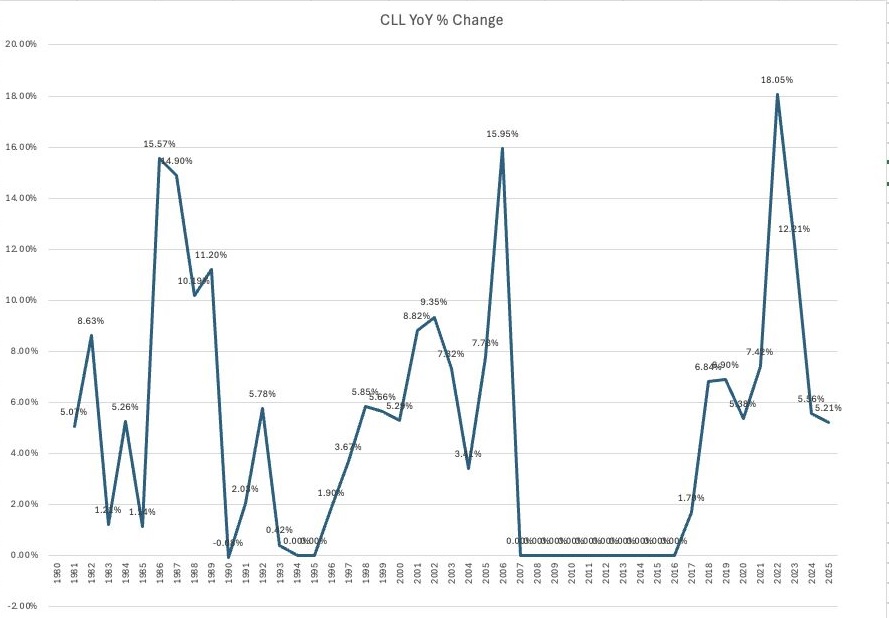
The first chart below shows the historical trend of conforming loan limits (blue bars) and average mortgage rates (orange line) since the 1980s. The second chart tracks the year-over-year percentage change in CLL.
Significant CLL increases tend to align with high-rate environments.
- Look at the early 1980s when rates were extremely high—loan limits rose steadily.
- The same happened between 2002-2007, right before the financial crisis.
- Post-2016, we see CLL increasing again as rates started rising.
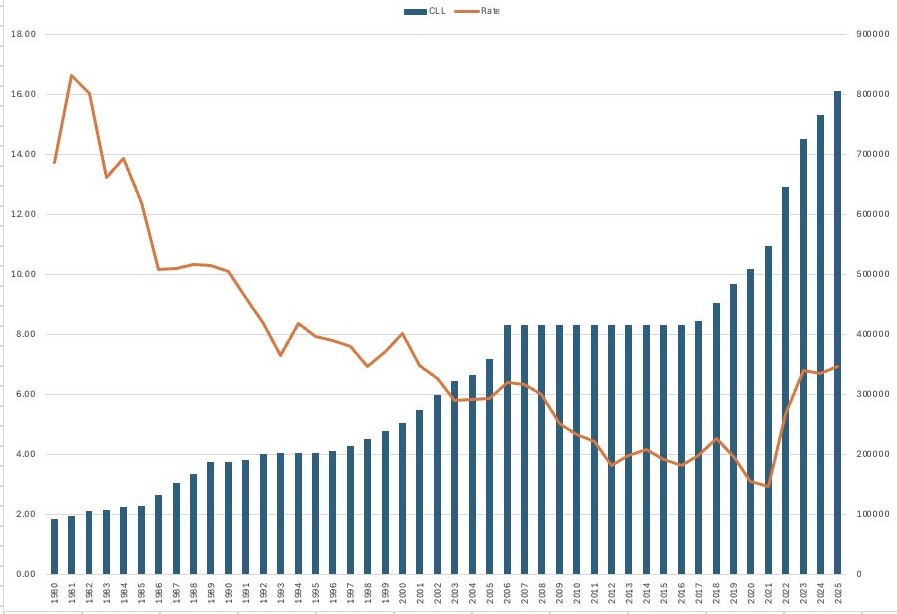
Periods of rate stability (or decline) are typically preceded by stable CLL growth.
- Between 1998 and 2006, CLL grew steadily but not aggressively, and rates were relatively stable.
- Similarly, 2010-2019 saw limited CLL movement and a period of relatively low mortgage rates.
- The COVID-era anomaly was a break from historical norms. CLL spiked, yet rates plummeted — thanks to massive government stimulus and intervention. That was an outlier, not the norm.
What This Means for 2025: No Big Rate Cuts Coming
Right now, CLL has been increasing at an accelerated pace, which signals that policymakers still see a market that needs adjustments for affordability. However, this growth in loan limits suggests stubborn inflation, sustained home price appreciation, and an overall “higher for longer” rate environment.
Until we hit a solid economic footing—like the 1998-2006 period or the 2010-2019 stretch, it’s unlikely that we will see substantial mortgage rate drops. The Federal Reserve might cut rates modestly, but mortgage rates, which follow bond yields, may not react dramatically.
Takeaways for Borrowers and Lenders
- For borrowers: If you’re waiting for 3% mortgage rates again, you might be disappointed. Consider locking in a rate when the opportunity arises rather than waiting indefinitely.
- For lenders: Expect a longer high-rate cycle and strategize accordingly. Borrower education, creative loan products, and targeted marketing based on rate tolerance will be key.
Final Thought: The Market Needs Stability Before Rates Fall
The pattern is clear—substantial rate drops typically follow prolonged stability, not rapid market changes. Given current economic conditions and CLL growth trends, 2025 is shaping up to be another year of elevated mortgage rates.
So while borrowers hope for a reprieve, history suggests patience is necessary. We might not see meaningful rate relief until we return to economic stability.
Stay informed, and plan accordingly.